Appearance
Presentation
1. Device Online
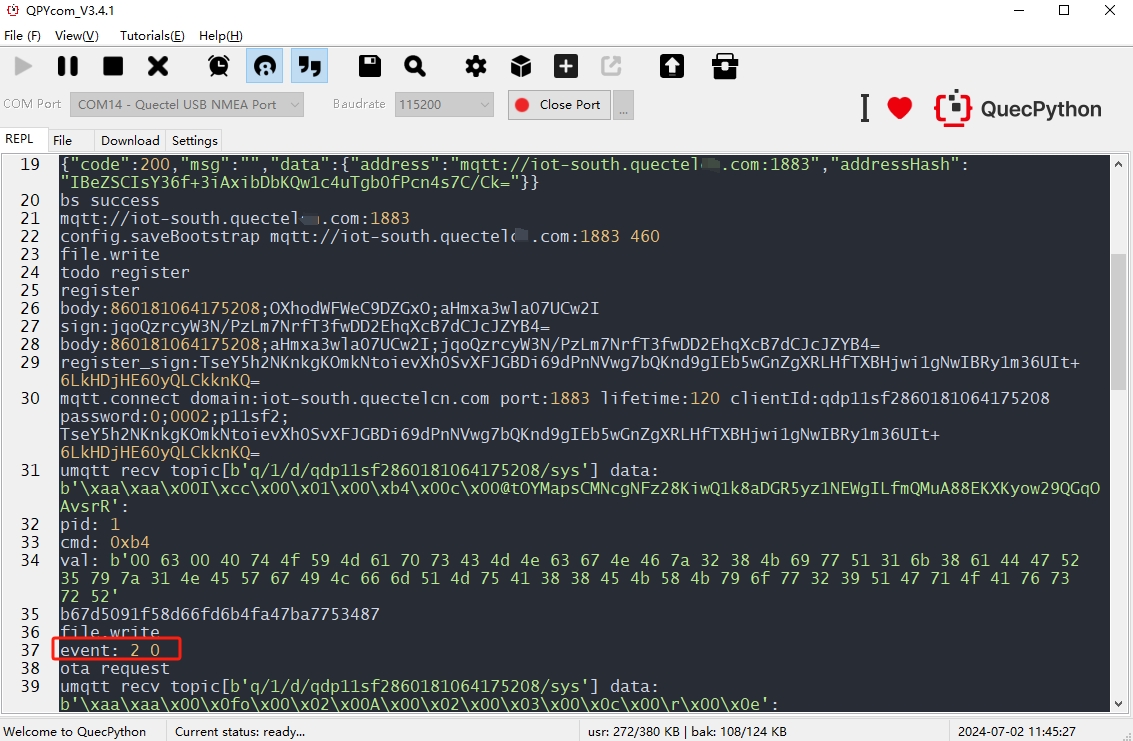
At this time, the module equipped with the program has started to run, and you can view the program on REPL page. REPL is used to communicate with the device at the PC end and issue commands to make the device work according to the developer's idea. At the same time, the device can return information to the PC, and the user can see the internal operation of the device in the interaction interface. When event: 2 0 is displayed on the interaction interface, it indicates the module has connected with Developer Center. The interaction interface of QPYcom is shown as follows.
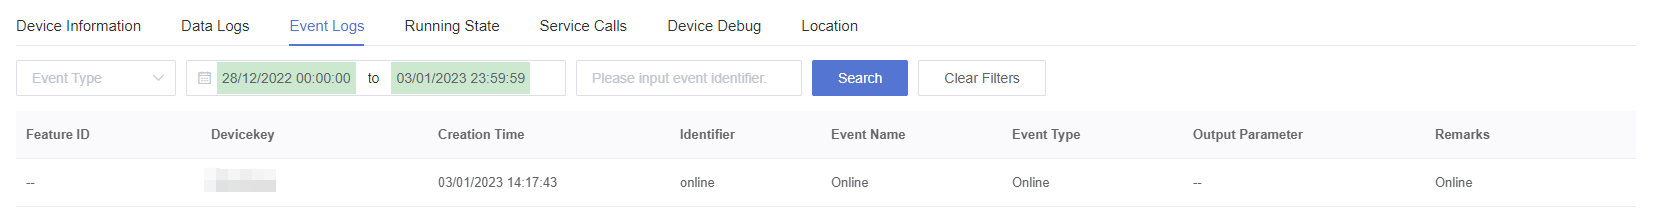
At this time, you can see the device is online from Developer Center. The presentation of Developer Center interface is shown below:
2. Debug Device Online
Note: Online debugging can be used to debug device features, properties and services. To ensure successful debugging, it is important to verify that the device is online and properly connected.
Draw up TSL features according to the actual project requirements of the smart aromatherapy diffuser. The default TSL model is presented in the table below.
| Feature ID | Feature Type | Feature Name | Data Format | Read/Write Type | Unit |
|---|---|---|---|---|---|
| 1 | Property | The remaining content of essential oil | FLOAT | Read-Only | ML |
| 2 | Property | Frequency of regular reporting | INT | Read-Write | Second |
| 3 | Property | On/Off status | BOOL | Read-Only | True: On; False: Off; |
| 4 | Event | Alert to lack of essential oil | BOOL | -- | True: Alert; False: Alert canceled; |
| 5 | Property | mode | ENUM | Read-Write | 1: Working Mode 1; 2: Working Mode 2; 3: Working Mode 3; |
| 6 | Service | Set working mode | -- | Feature ID: 5 |
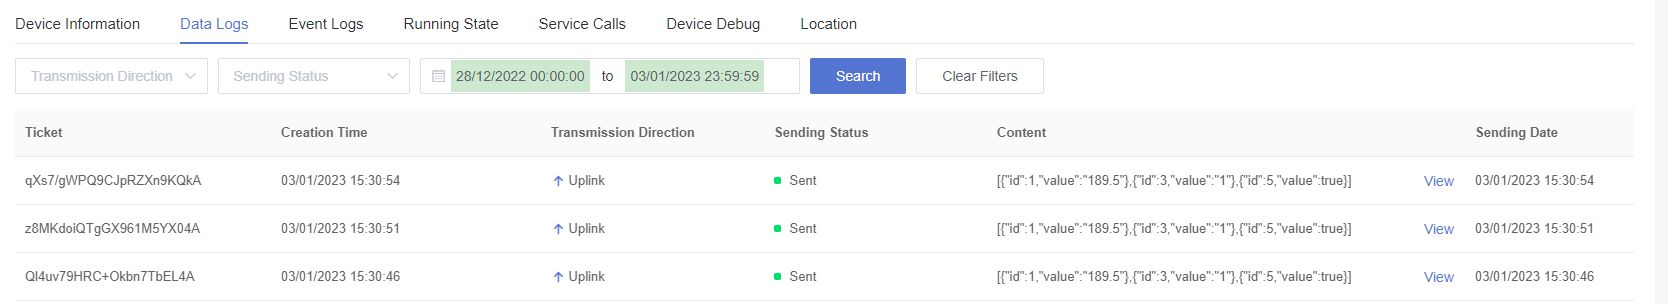
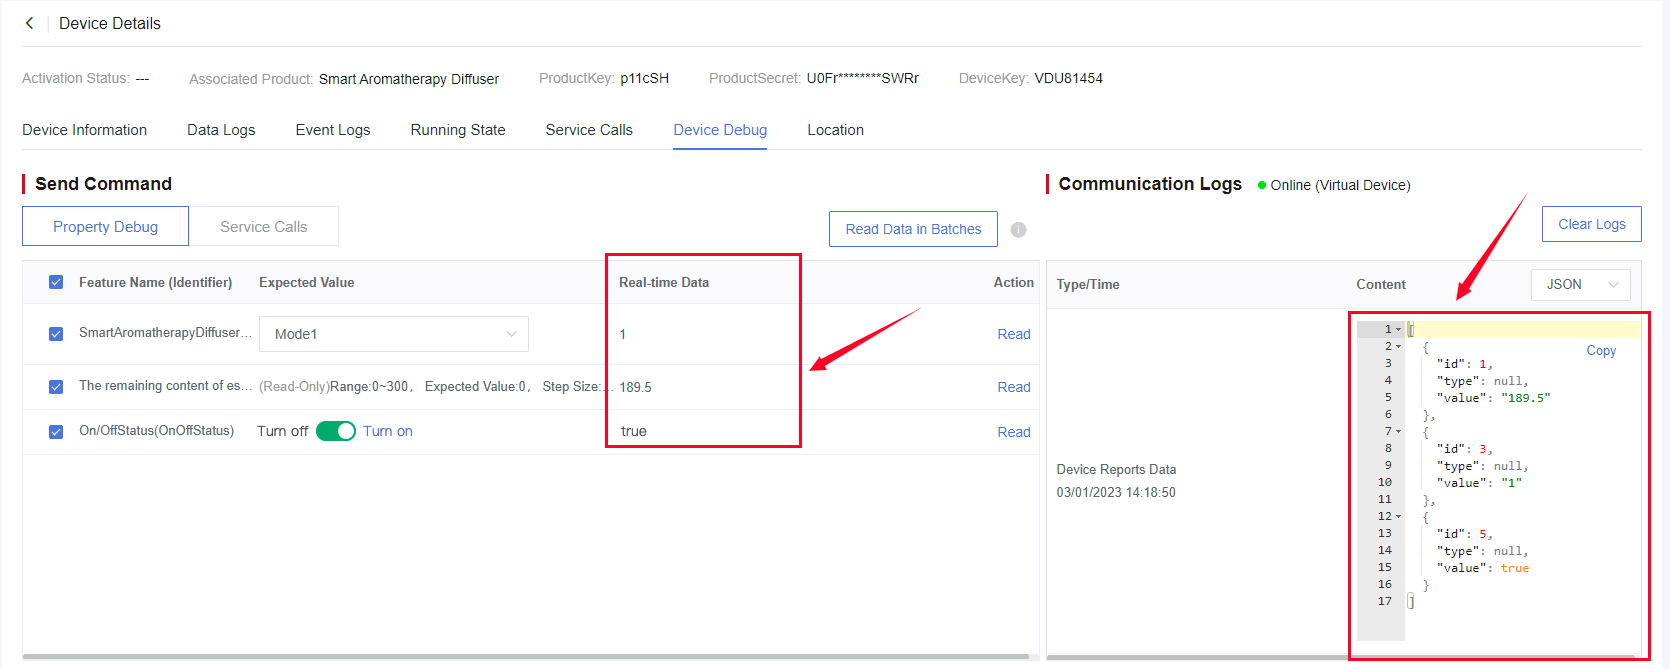
1) View Data Logs
The communication logs indicate that the device reports the remaining content of essential oil to Developer Center every 30 seconds.
2) Read the Current Property Value
Click a single property to Read, and then Developer Center will send the querying command to the device. You can also read Communication Logs in real time to check the situation of data sent and reported by the device.
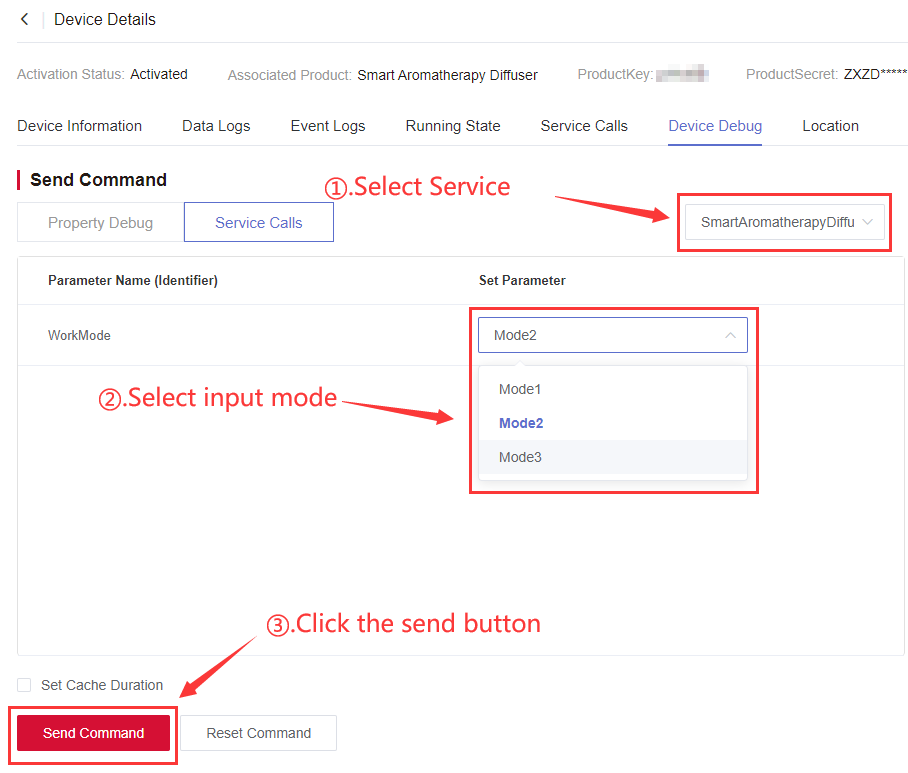
3) Call Service
According to Device Debug > Service Calls defined by TSL features, you can simulate the condition of remotely issuing commands. On the "Device Debug" page, select "Set Working Mode", set the parameter to Working Mode 2 and click "Send Command", then you can see that the device has received the service issued by Developer Center.
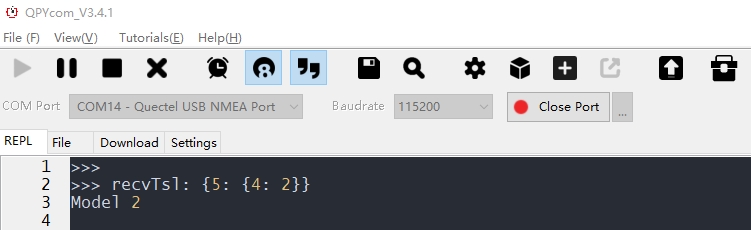
At this time, the device has received the callback event and service data. The interaction interface of QPYcom is shown as follows.
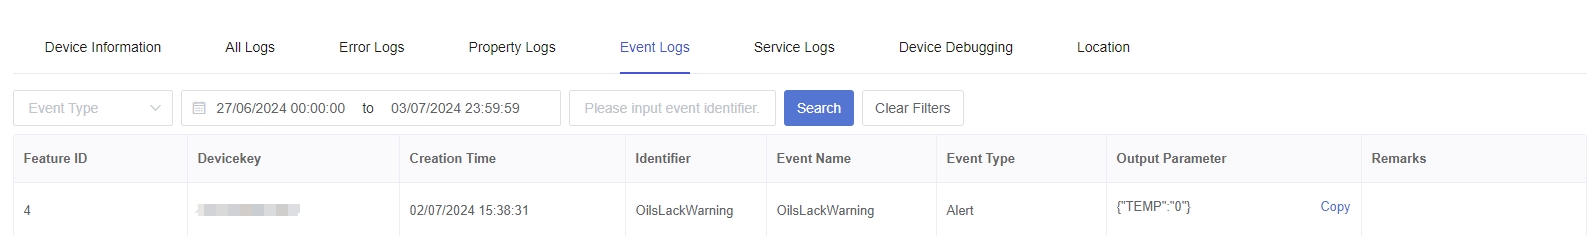
4) Alert Event Logs
You can use the Event Logs feature to monitor alert events generated by the device. The feature allows you to view how the device automatically reports alert events to Developer Center in real time.