Appearance
Presentation
1. Device Online
1) Device Online
Download the program code to the module and the module will automatically connect to Developer Center according to the program. When the module is connected to Developer Center, the device will be automatically added to the product and automatically authenticated.
2) Device Debug
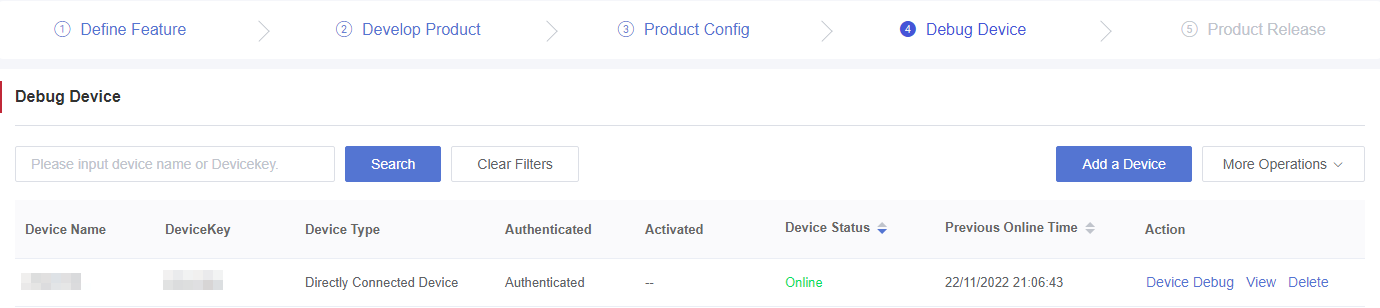
After the module is connected to Developer Center, you can debug the device in the "Console" page.
Enter the "Device Management" > "Device Maintenance" page, click "View" in the "Action" bar of the corresponding device to enter the "Device Details" page, and then click the "Device Debugging" tab to debug TSL data online.
2. Debug Device Online
Note: "Device Debugging" is used to debug device features, properties and services. Please ensure that the device is online normally during debugging.
Draw up TSL features according to the actual project requirements of the smart aromatherapy diffuser. The default TSL model is presented in the table below.
| Feature ID | Feature Type | Feature Name | Data Format | Read/Write Type | Unit |
|---|---|---|---|---|---|
| 1 | Property | The remaining content of essential oil | FLOAT | Read-Only | ML |
| 2 | Property | Frequency of regular reporting | INT | Read-Write | Second |
| 3 | Property | On/Off status | BOOL | Read-Only | True: On; False: Off; |
| 4 | Event | Alert to lack of essential oil | BOOL | -- | True: Alert; False: Alert canceled; |
| 5 | Property | mode | ENUM | Read-Write | 1: Working Mode 1; 2: Working Mode 2; 3: Working Mode 3; |
| 6 | Service | Set working mode | -- | Feature ID: 5 |
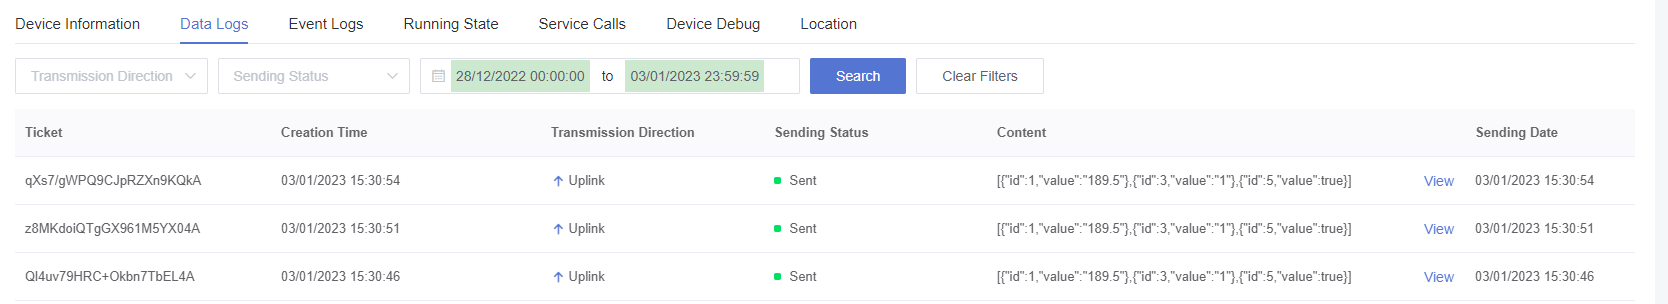
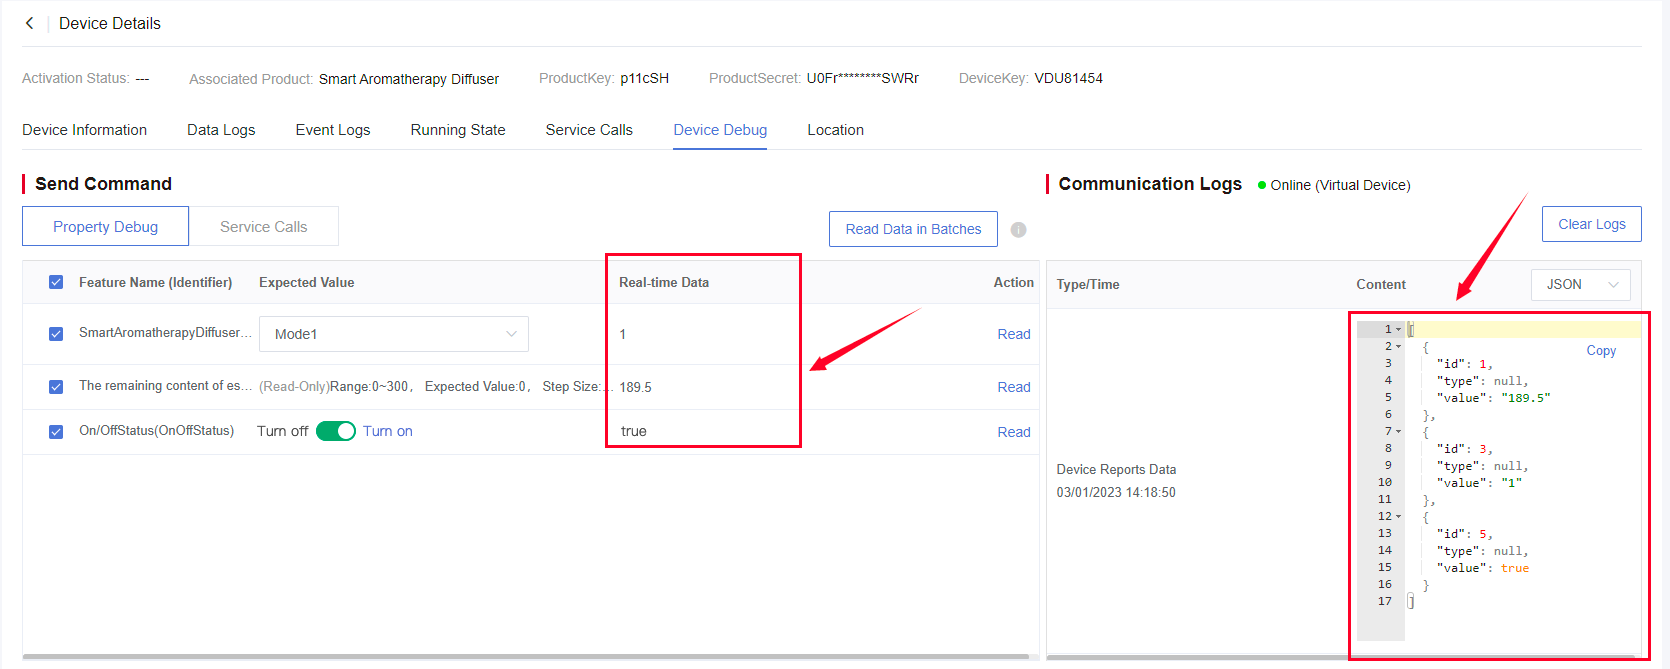
1) View Data Logs
The communication logs indicate that the device reports the remaining content of essential oil to Developer Center every 30 seconds.
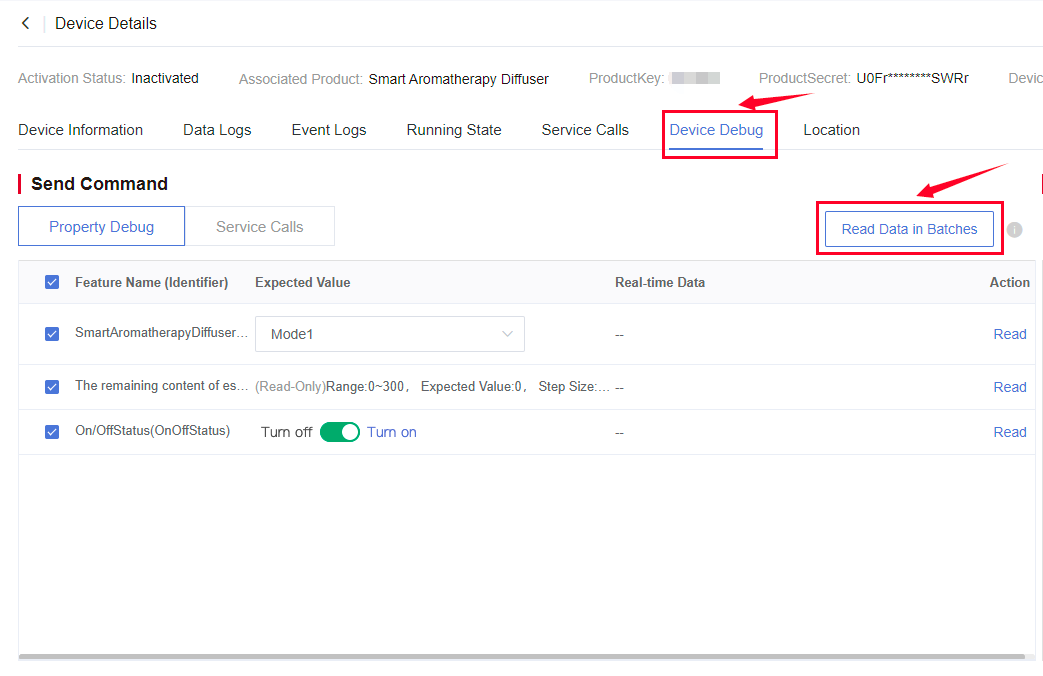
2) Read the Current Property Value
Click "Read in Batches" or "Read" of a single property, and then Developer Center will send the querying command to the device. You can also read Communication Logs in real time to check the situation of data sent and reported by the device.
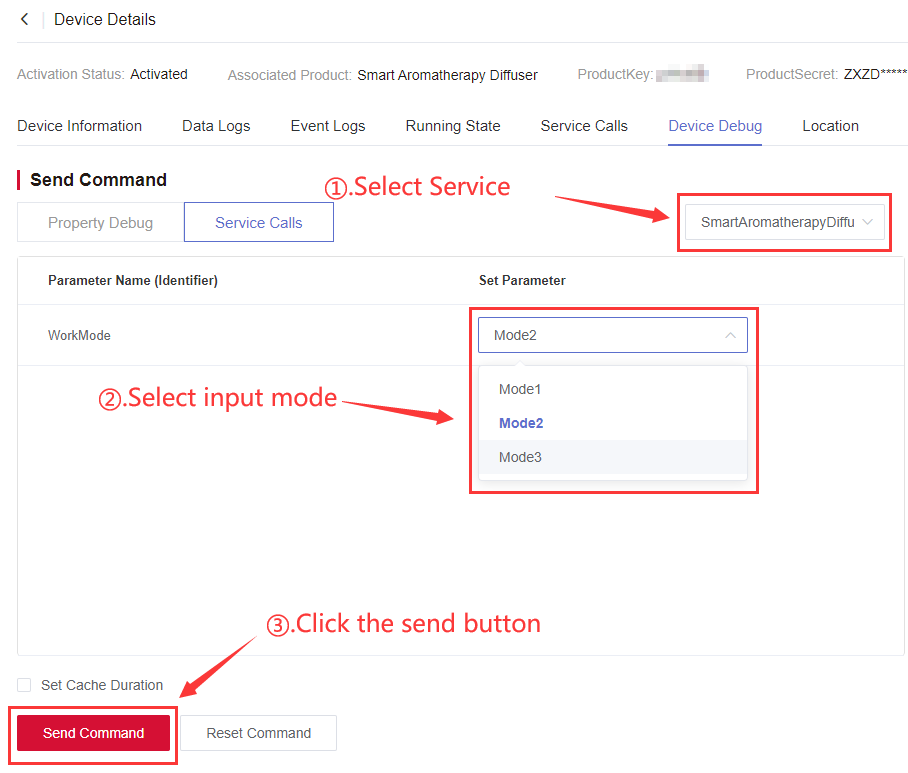
3) Call Service
According to Device Debug > Service Calls defined by TSL features, you can simulate the condition of remotely issuing commands. On the "Device Debug" page, select "Set Working Mode", set the parameter to Working Mode 2 and click "Send Command", then you can see that the device has received the service issued by Developer Center.
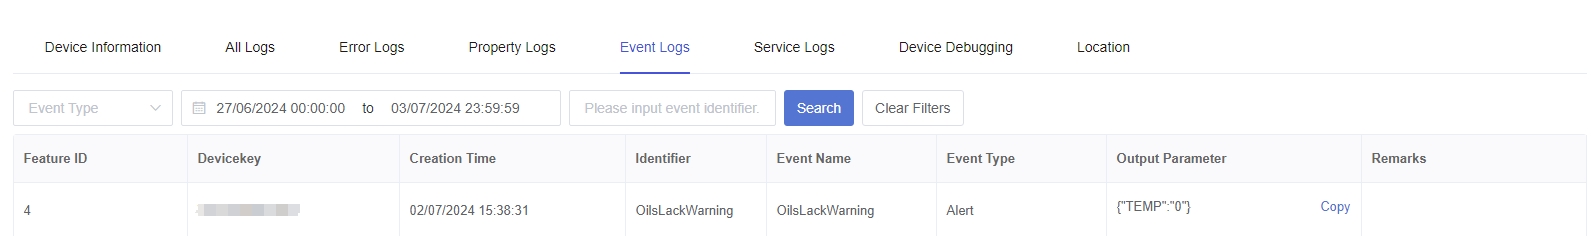
4) Alert Event Logs
You can use the Event Logs feature to monitor alert events generated by the device.