
Appearance
User Manual
Program Introduction
Introduction
QthTools-MCU Simulator is a simulation assistant that simulates the communication between the main control MCU and Quectel module. It has powerful features such as connecting to Developer Center, data interaction using AT commands, TSL, transparent transmission, OTA, and gateway sub-devices. The log debugging and log analysis features can effectively improve the user's functional understanding of the module or app, which facilitates the verification and debugging of the module or app capabilities, thereby improving the efficiency of overall solution development and acceptance.
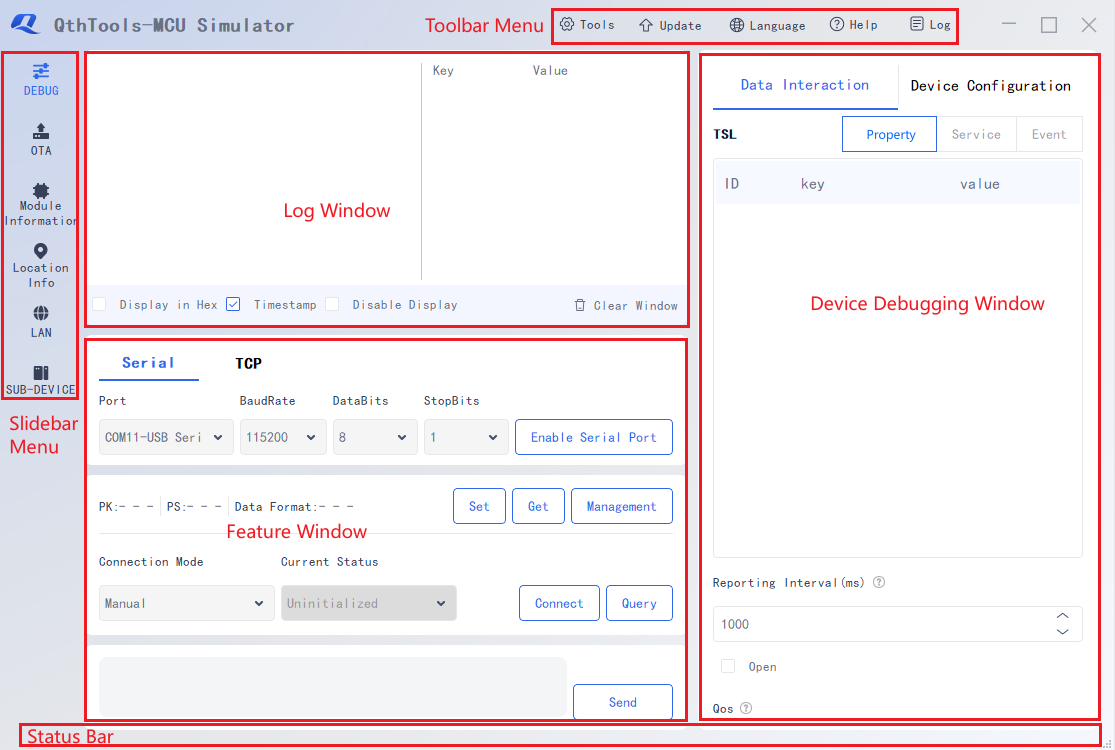
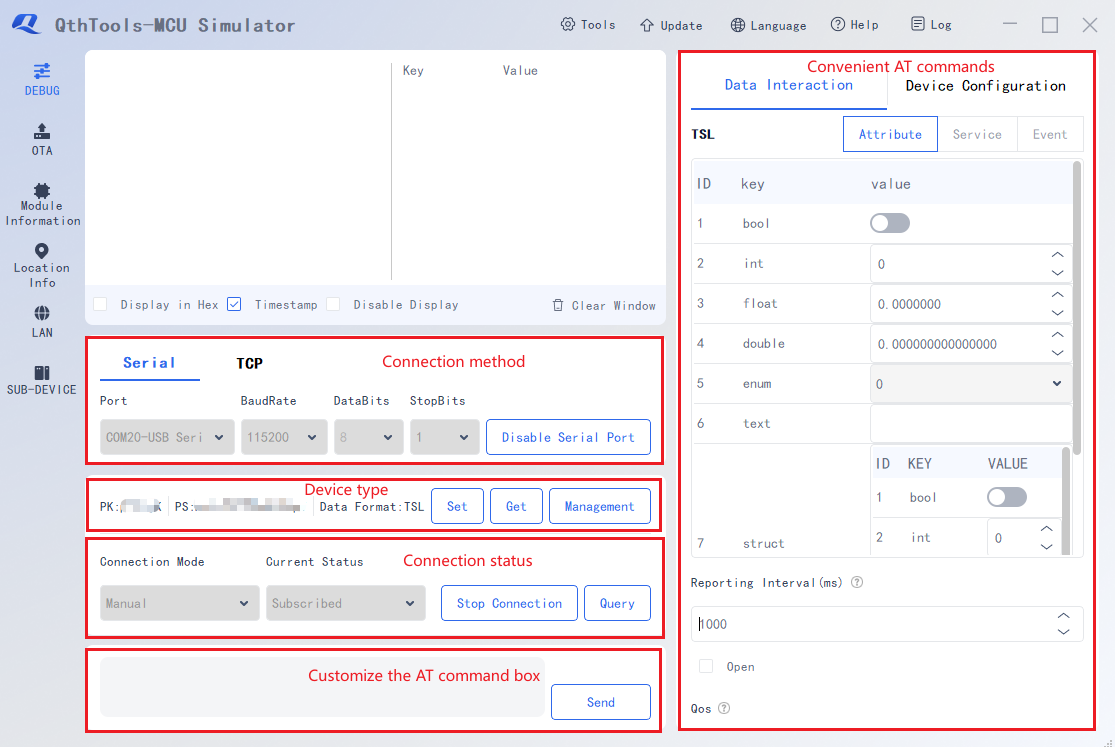
Framework
The tool's name is QthTools-MCU Simulator and it is currently at version 3.0.1.
- Toolbar Menu
The toolbar menu includes five features, "Tools", "Update", "Language", "Help", and "Log", where you can parse and convert protocols, perform some convenient operations and save logs.
- Sidebar Menu
The sidebar menu includes six features, "Debug", "OTA Upgrade", "Module Info", "Location Info", "LAN" and "Sub-device".
- Log Window
The log output interface displays the logs output after QthTools-MCU Simulator is connected to the SDK or module. It provides relevant information and helps you view and understand the information easily. The log analysis interface parses the AT commands in the log output interface to help you quickly understand the format and meaning of the AT commands. There are four log output setting features, "Display in Hex", "Timestamp", "Disable Display" and "Clear Window". The "Display in Hex" button is used to output the data in hexadecimal format in the log.
- Device Debugging Window
The device debugging window includes "Data Interaction" and "Device Configuration" sections, providing convenient AT commands during device debugging.
- Feature Window
The feature window displays the various features of the feature bar to realize visual operations.
- Status Bar
The status bar displays information on operations and their results without affecting the overall program operation. Important information will be displayed in a pop-up window to prompt the user.
Toolbar Menu Introduction
- Tools
The "Tools" contains the TTLV and JSON converter and the multi-string tool. The TTLV and JSON converter allows users to quickly analyze or generate TTLV data. The multi-string tool can store some AT commands and can quickly enter the commands in the next debugging.
- Update
Update QthTools-MCU Simulator and get tool information. You can get the latest version of QthTools-MCU Simulator by clicking "Update Version".
- Language
Switch languages (Only Chinese and English are supported currently).
- Help
Click "Documentation" to redirect to the user manual.
- Log
Export use logs and exception logs. If any exception occurs when you use the tool, you can export the corresponding logs to the developer for troubleshooting, thus improving the efficiency of problem positioning.
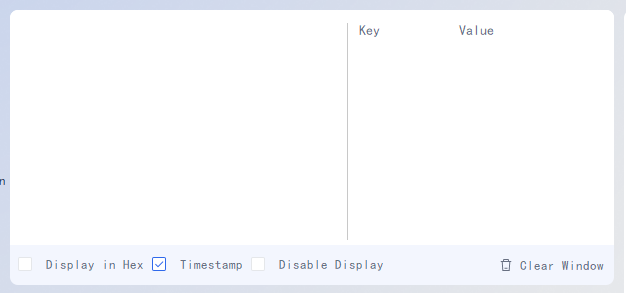
Log Window
To view additional log information, you can stretch the display window by pulling down the bottom line of the box.
- Display in Hex
After "Display in Hex" is checked, when you receive hexadecimal data, the data will be printed synchronously to the log output window.
- Timestamp
After "Timestamp" is checked, a timestamp will be added to the logs sent and received from the serial port.
- Disable Display
After "Disable Display" is checked, if you receive debugging data, the data will not be printed to the log output window.
- Clear Window
Click "Clear Window" to clear the logs displayed in the log display window.
Log Output Interface
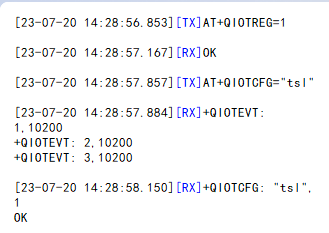
[TX] : Data sent by the QthTools-MCU Simulator.
[RX] : Data received by the QthTools-MCU Simulator.
Timestamp : Display or not to display timestamps by checking or not checking "Timestamp" on the "Debug" interface.
Display in Hex : It displays the received hexadecimal data.
Disable Display : Window display feature can be disabled, e.g., to prevent the previous commands from being overwritten when performing operations of SOTA upgrades. Currently, the log window only displays the last 1000 lines of records.
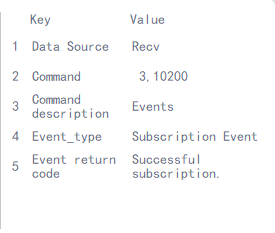
Log Analysis Interface
Clicking the corresponding log in the log window will trigger the analysis of the AT commands in the log. Currently, only the AT commands related to Developer Center are supported for analysis, while other AT commands cannot be processed.
Device Debugging Window
Data Interaction Tab
Data interaction commands are used for the interaction between the device and the platform, including devices' reporting data to the platform or receiving the issued data from the platform. You can modify and view the data in the interface.
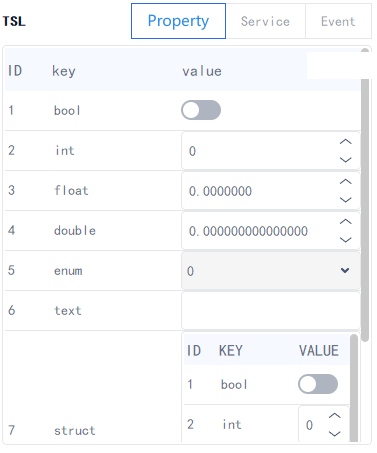
TSL Model
TSL Model List
TSL models can be divided into three categories: properties, services, and events. According to the selected product information, the corresponding TSL model list is generated. If the selected data type is transparent transmission/custom or the imported JSON file is incorrect, the TSL model list is displayed as empty.
Single Selection : Select a single TSL model ID with your mouse.
Multiple Selections : Keep pressing "Ctrl" on your keyboard and select multiple TSL model IDs with your mouse.
Select All : Press "Ctrl" + "A" on your keyboard.
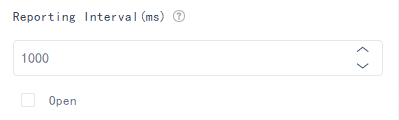
Regular Reporting : After this option is enabled, the tool will regularly report the ID selected in the TSL model list above according to the set reporting interval.
- Reporting Interval : Range: 1–600,000. Unit: milliseconds.
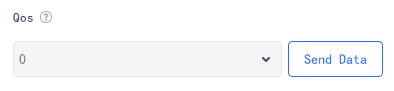
Send Data : Send the data selected in the TSL model list by clicking "Send Data". Single selection, multiple selections, and select all are supported.
Mode 0 : Send data once.
Mode 1 : Send data multiple times to ensure that the server receives the data at least once.
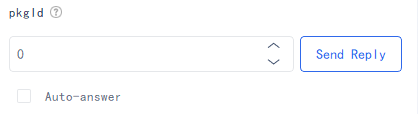
Send Reply
Select response data in the TSL model list and click "Send Reply". Single selection, multiple selections, and select all are supported.
PkgID : The latest PkgID for Developer Center reading the TSL model ID. You can also manually modify the PkgID.
Auto-answer : When this option is checked, Developer Center platform will automatically respond with the corresponding TSL model ID to the device after reading the TSL model ID.
Read Data
This feature is only effective when "Buffer Mode" is set to "Enable" on the product configuration page. If it is set to "Disable", the data received from Developer Center will be automatically updated in the TSL model list above.
Read Data : Read the TSL data of the specified number of bytes to be read and update the data to the TSL model list above.
Get Maximum : Read TSL model data of the maximum number of bytes (10240) and update the data to the TSL model list above.
Remaining Bytes : The remaining number of bytes in the current data group.
Remaining Groups : The remaining number of buffered data groups.

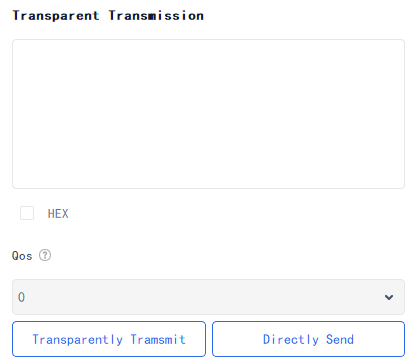
Transparent Transmission
Send Data
Hover over the input box and you can view the pop-up of "No more than 4096 bytes".
HEX : You can select the reported data type to be string or hexadecimal byte stream.
QoS : Default value: 0. More options are available such as 1, 2, 100, 101 and 102.
Sending Method : Transparently transmit and directly send. If "HEX" is checked, only "transparently transmit" is supported.
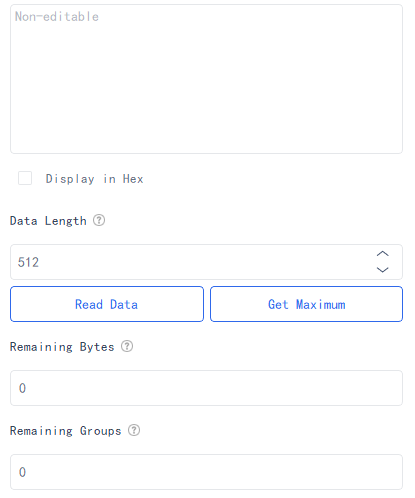
Read Data
This feature is only effective when "Buffer Mode" is set to "Enable" on the product configuration page. If it is set to "Disable", the data received from Developer Center will be automatically updated in the transparent transmission data window.
Read Bytes : Read the transparent transmission data of the specified number of bytes to be read and update the data to the transparent transmission data window above. Maximum value: 10240 bytes.
Remaining Bytes : The remaining number of bytes in the current data group.
Remaining Groups : The remaining number of cached data groups.
Sending Method : Read data and get the maximum length of data read.
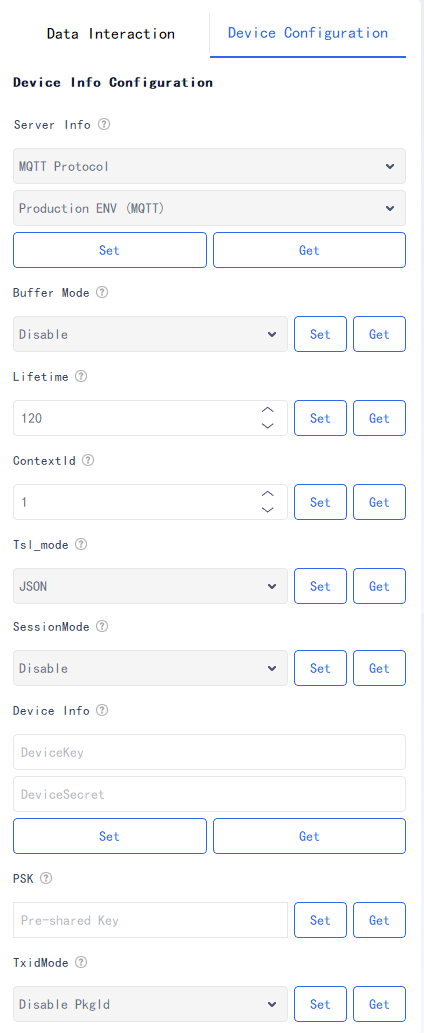
Device Configuration Tab
The device configuration tab provides commonly used AT command templates. By entering or selecting the corresponding configuration, you can quickly generate AT commands and send them.
Server Info : There are two supported protocols for server connection: MQTT and LwM2M. If the MQTT protocol is selected, only the production environment (MQTT), production environment (HTTP), and custom environments are supported. If the LwM2M protocol is selected, only the production environment (CoAP) and custom environments are supported.
Buffer Mode : Disable buffer mode (default): When Developer Center issues transparent transmission data to the module, the module will actively print the data to the serial port. Enable buffer mode: When Developer Center issues transparent transmission data to the module, the module does not print data to the serial port. The MCU needs to send an AT command to read the buffered data out.
Keep Alive Interval : Device's life cycle. Range: 1–86400. Unit: second.
ContextId : Range: 0–99.
TSL Mode : Select one from TTLV, a hexadecimal data format processed according to the protocol, and JSON, a subset based on JavaScript and an open and lightweight data format.
Encryption Mode : Whether to add TLS encryption service based on MQTT or HTTP.
Device Info : Device IMEI and DeviceSecret.
PSK : The Pre-shared key is equivalent to a password and must be unique. If this option is not specified, it will be automatically generated based on the DeviceKey.
TxidMode : After PkglD is enabled. the device will receive the PkglD of uplink messages returned by Developer Center when the device successfully sends uplink TSL data to Developer Center. This option is set to "Disable PkgID" by default, that is, the PkglD of uplink messages will not be returned to the device.
Sidebar Menu
Debug Interface
Clicking "Debug" in the left sidebar menu to enter the debugging interface.
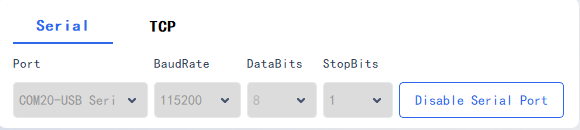
Serial Port Configuration
Select the corresponding serial port, baud rate, data bits, stop bits, and other parameters.
Enable Serial Port : Once the serial port is enabled, the serial port configuration cannot be modified. If you need to modify the parameters, please disable the serial port first.
Disable Serial Port : If the device has connected to Developer Center, the connection will be ended when the serial port is disabled.
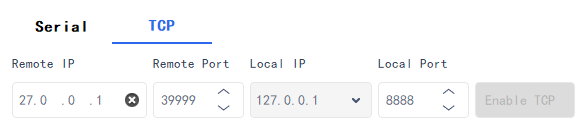
TCP Configuration
The remote IP format is restricted to only numbers and "." characters. Additionally, the input must conform to the standard IP format. To delete an IP, click the "x" icon located on the right-hand side of the input box.
Enable TCP
When this feature is enabled, the system will automatically retry the connection up to 3 times if the initial TCP connection attempt is unsuccessful
Disable TCP
If the connection to the Developer Center is active, it will be disconnected when the TCP is closed.
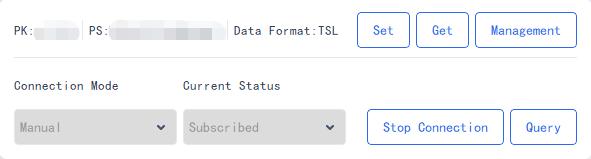
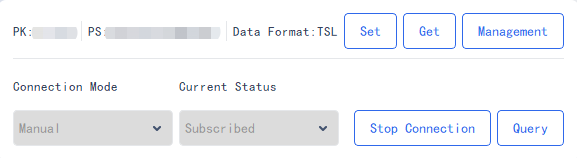
Product Configuration
This section is used for product configuration and addition. Click "Set" to set the product information for the device. Click "Get" to get the current product configuration. Click "Manage" to switch, add, and delete products.
- Product List
The added product information will be displayed in a table. By selecting a product, if the selected product's data type is the TSL model, you can view the TSL data in the "Data Interaction" interface on the left side of the debugging interface.
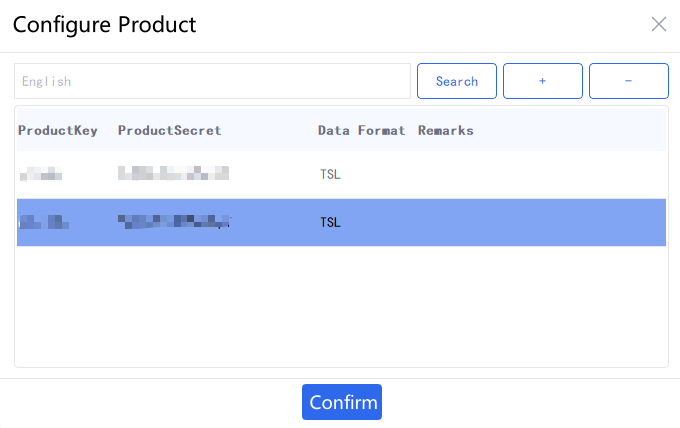
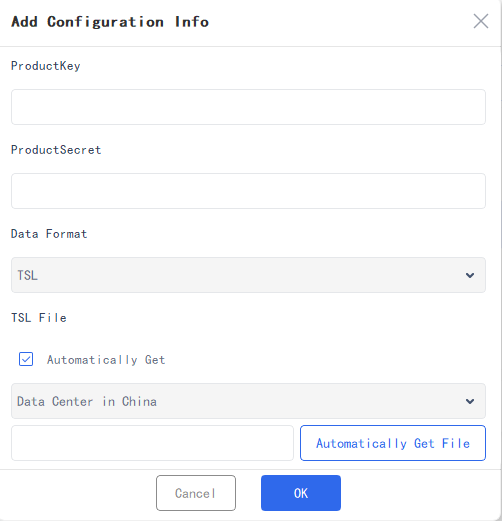
- Add Product
Click "+" to enter the "Add Configuration Info" window. Enter the PK and PS in the correct format, select the corresponding data format, and if you select "TSL", you need to import the TSL model file manually or automatically. After the configuration, click "OK" to complete the product configuration. The product information will be displayed in the product list.
Delete Product : Select one or more lines in the product list and click "-", then a confirmation window will pop up. Click "Confirm" to delete the product information.
Search Product : Enter the information of the desired product in the search box and click "Search" to quickly search for the corresponding product in the current product list. This feature only supports fuzzy search, and if no matching product is found, the first line in the list will be returned.
Product Remarks : Double-click on the cell in the "Remarks" column of the line for which you want to add a remark. An input box will pop up where you can enter remarks. Click "Confirm" to confirm the remark.
Connection Mode
Activate the connection mode to connect to the features on Developer Center.
- Manual : Manually connect to Developer Center.
- Auto : Actively connect to Developer Center when the network is available.
Current Status
Current status of the connection to Developer Center:
- Uninitialized
- Initialized
- Authenticating
- Authenticated
- Authentication failed
- Registering
- Registered
- Waiting to subscribe
- Registration failed
- Subscribed
- Data can be sent
- Subscription failed
- Logging out
- Logged out
- Logout failed
Connect : The module will connect to Developer Center using the selected product configuration information.
Disconnect : Disconnect the device from Developer Center.
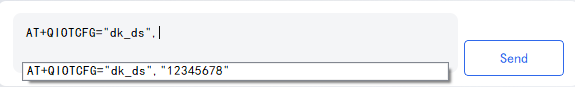
Send AT Command
The AT command input box is used to send AT commands and includes history records. As you type a part of an AT command, a prompt box will appear to help you complete the command.
OTA Upgrade Interface
MQTT
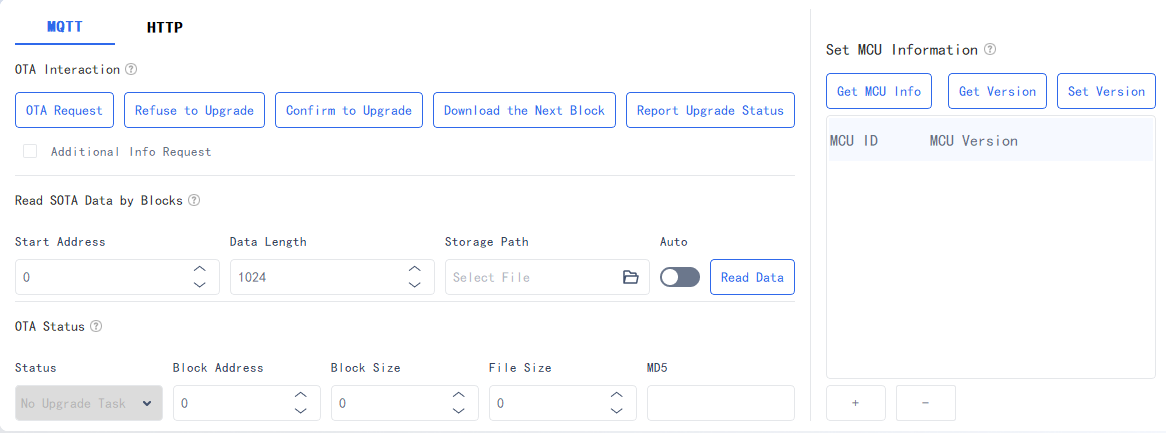
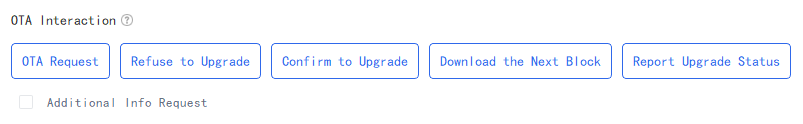
OTA Interaction
MQTT-OTA interaction is used for confirmation when the module receives an upgrade task issued by Developer Center.
OTA Request Get the current plan matching Developer Center upgrade task.
Additional Info Request Attach the sha256 firmware calibration information to the OTA request.
Refuse to Upgrade Reject the issued upgrade task.
Confirm to Upgrade Accept the current upgrade task.
Download the Next Block During MQTT-SOTA, if the MQTT-SOTA firmware is too large, it must be downloaded in split packets. Click "Download the Next Block" to download the next package of data after receiving the split packet.
Report Upgrade Status During MQTT-SOTA, after successful firmware download and verification, click "Report Update Status" to report the firmware update status to Developer Center when the firmware update is performed.
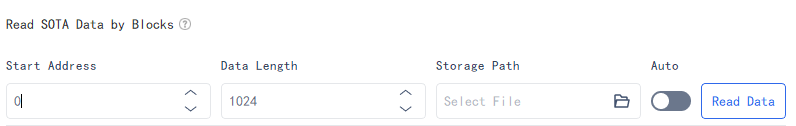
Read SOTA Data by Blocks
Read the firmware data saved in the module for SOTA upgrades.
Start Address File offset address in the file from where the data should be read.
Data Length The length of the file to be read.
Storage Path Select the storage path of the firmware data to be read in SOTA upgrades.
Auto When the "Auto" option is enabled, you can simply click "Read Data" once, and then the download process will be automatically completed and calibrate the MD5 hash.
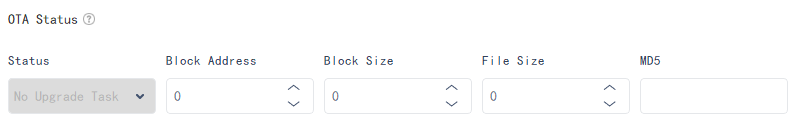
OTA Status
Displays the current MQTT-OTA task status and download progress.
Status Current MQTT-OTA status.
Block Address Starting address of the firmware block that is being downloaded by the module.
Block Size Size of the firmware block that is being downloaded by the module.
File Size File size of the firmware that is being downloaded by the module.
MD5 File MD5 checksum the file that is being downloaded by the module.
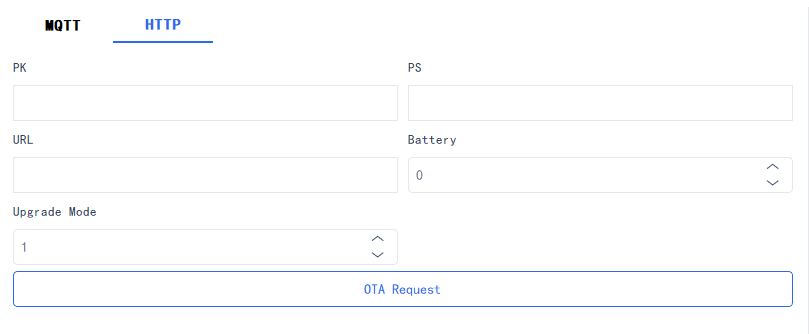
HTTP-OTA
You need to configure "PK", "PS", "URL", "Battery" and "Upgrade Mode", and then click "OTA Request ".
Set MCU Version
MCU version settings are used for SOTA upgrades.
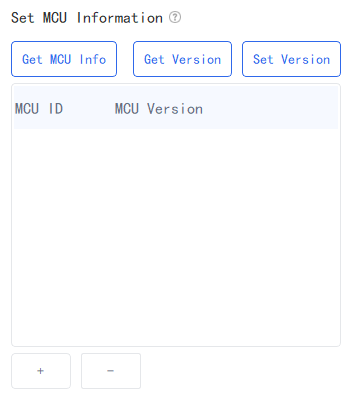
- Get MCU Info Get all MCU IDs and their corresponding version numbers saved by the module, and update them to the list below.
- Get Version Select an "MCU ID" from the list below, and then click "Get Version" to fetch its corresponding version number and update it to the list below.
- Set Version Select an "MCU ID" from the list below, and modify its corresponding MCU version number. Click "Set Version" to update the selected MCU ID and version number in the module.
- Add MCU Click "+" to add an MCU ID and an MCU version number to the list and edit them.
- Delete MCU Select an MCU from the list and click "-" to delete the selected MCU from the list, and delete its corresponding MCU inside the module.
Module Info Interface
Obtain module information through AT commands and display the information in a table. Click "Report to Platform" to report the module information to Developer Center.
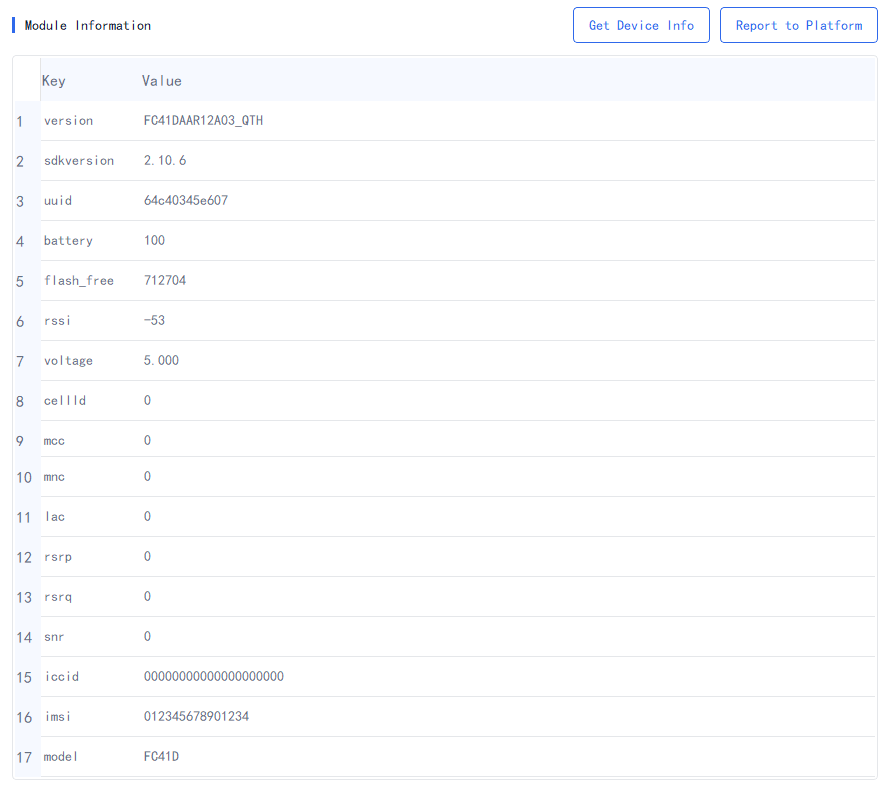
- Get Device Info Get the current module information through AT commands and display it in the module information table.
- Report to Platform Execute AT commands to report the current module information to Developer Center. Once reported, the module information can be viewed on the platform.
Location Info Interface
Built-in Info
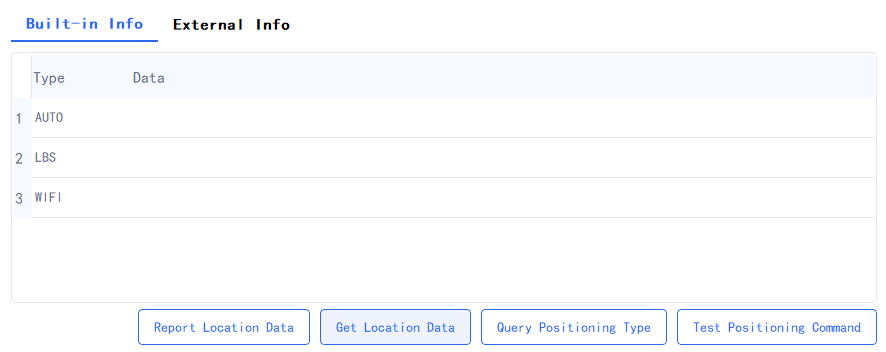
- Test Positioning Command View the commands of the current module's built-in positioning feature in the log interface.
- Query Positioning Types Get the supported positioning types of the current module and display them in the table above.
- Get Location Data Select the desired location type(s) in the table above and click "Get Location Data" to get the location information data for the selected type(s) and display it in the table above.
- Report Location Data Select one or more lines in the table above and click "Report Location Data" to report the location data to the platform.
External Info
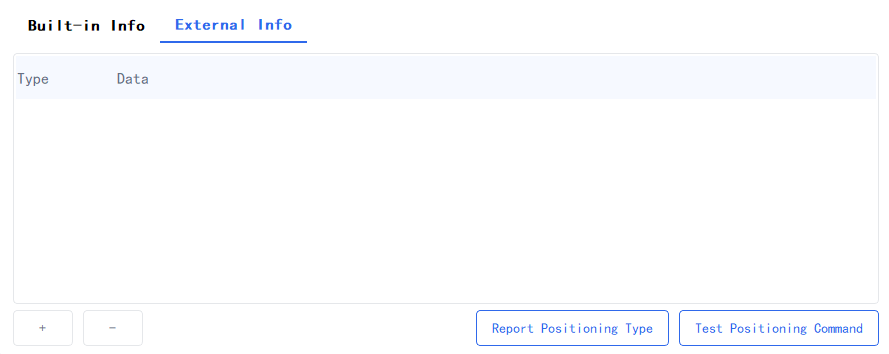
- **+ ** Add a new line in the table above and manually enter the external location information.
- - Select one or more lines in the table above and click "-" to delete the selected lines and information.
- Test Positioning Command View the commands of the current module's external positioning feature in the log interface.
- Report Positioning Type Select one or more lines in the table above and click "Report Location Data" to report the location data to the platform.
LAN Interface
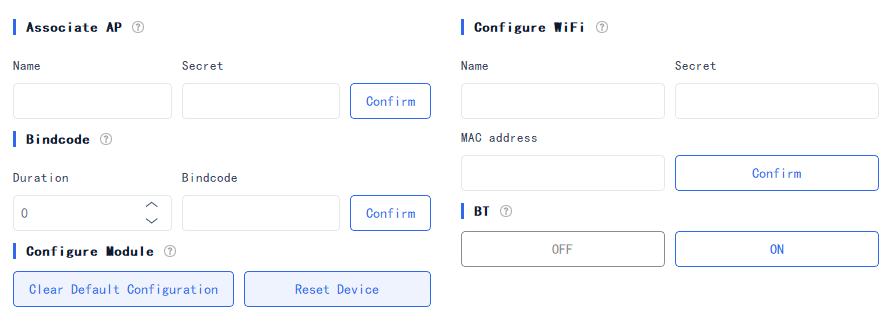
Associate AP
This feature is used to configure the module's AP name and secret. The name cannot be empty, but the secret can be left empty. After configuration, click "Confirm" to send the associated AP configuration command.
Bindcode
Bindcode is required for the device binding type of "Detect Nearby Devices". The device needs to report the same bindcode as the app to the platform to complete the binding. Duration range: 0–3600.
Configure Module
- Clear Default Configuration Send the command to clear the default module configuration.
- Reset Device Send the command to reset the device, restoring the device configuration to the initial state.
Configure Wi-Fi
This option is used to configure the name and secret of the module to connect to the target AP device. Enter the name and secret of the target AP (The name cannot be empty, but the secret and MAC address can be left empty). After configuration, click "Confirm" to send the Wi-Fi configuration command.
BT
This option is used to turn on or off the module Bluetooth. Click "ON" or "OFF" to send the corresponding command to turn the module Bluetooth on or off. The current version only supports turning on Bluetooth.
Sub-device Interface
The sub-device feature provides debugging capabilities for sub-devices under the gateway. Before debugging a sub-device, the sub-device must be online, that is, the sub-device in the debugging interface must be connected to Developer Center and online. Then, select the sub-device to be debugged.
Keep-alive Switch Click the button in the "Keep-alive Switch" column to control the keep-alive mechanism of the sub-device.
State The current connection status of the sub-device. If the switch is moved to the right and the color is blue, it indicates the sub-device is connected successfully and can be debugged.
Connect Control the connection of the sub-device. Click "Connect" to send the connection command to establish a connection. If the connection is successful, the button will change to "Disconnect"; Click "Disconnect" to send the disconnect command to terminate the connection, and the button will change to "Connect".
Remarks Double-click on the cell in the "Remarks" column of the line for which you want to add a remark. An input box will pop up where you can enter remarks. Click "Confirm" to confirm the remark.
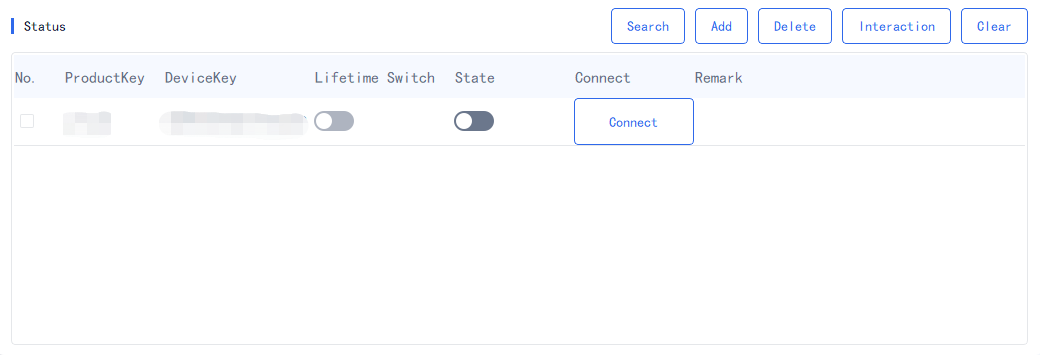
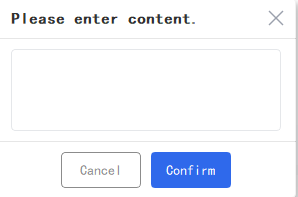
Search Device
Click "Search" to pop up an input box. Enter the information of the device you want to search and click "Confirm". This feature only supports fuzzy search, and if no matching device is found, the first line in the list will be returned.
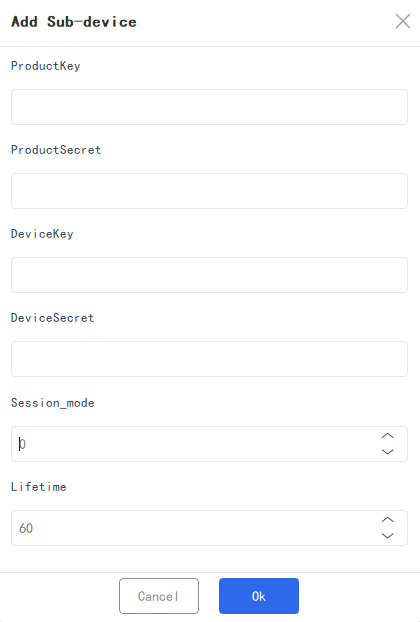
Add Device
Click "Add" to pop up the "Add Sub-device" window. Enter the PK, PS, DK and DS in the correct format and select the corresponding data format. If you select the TSL model, you need to import the TSL model file manually or automatically. After configuration, click "OK" to add the sub-device. The device information will be displayed in the product list.
Delete Device
Select one or more lines in the table below, then click "Delete". A confirmation window will pop up, and upon confirmation, the selected sub-device information will be deleted.
Device Interaction
Select a row that represents the sub-device you want to debug in the table below and click "Interaction". The corresponding TSL model or transparent transmission debug interface based on the selected sub-device's data format will be displayed. If the sub-device's data format is transparent transmission, only the transparent transmission debugging interface will be displayed. The debugging steps for the sub-devices in TSL model and transparent transmission format are the same as that for the gateways.

Clear DeviceSecret
Select one or more rows in the table, then click "Clear". A confirmation window will pop up, and upon confirmation, the tool will clear the saved DeviceSecret(s) for the corresponding device(s).